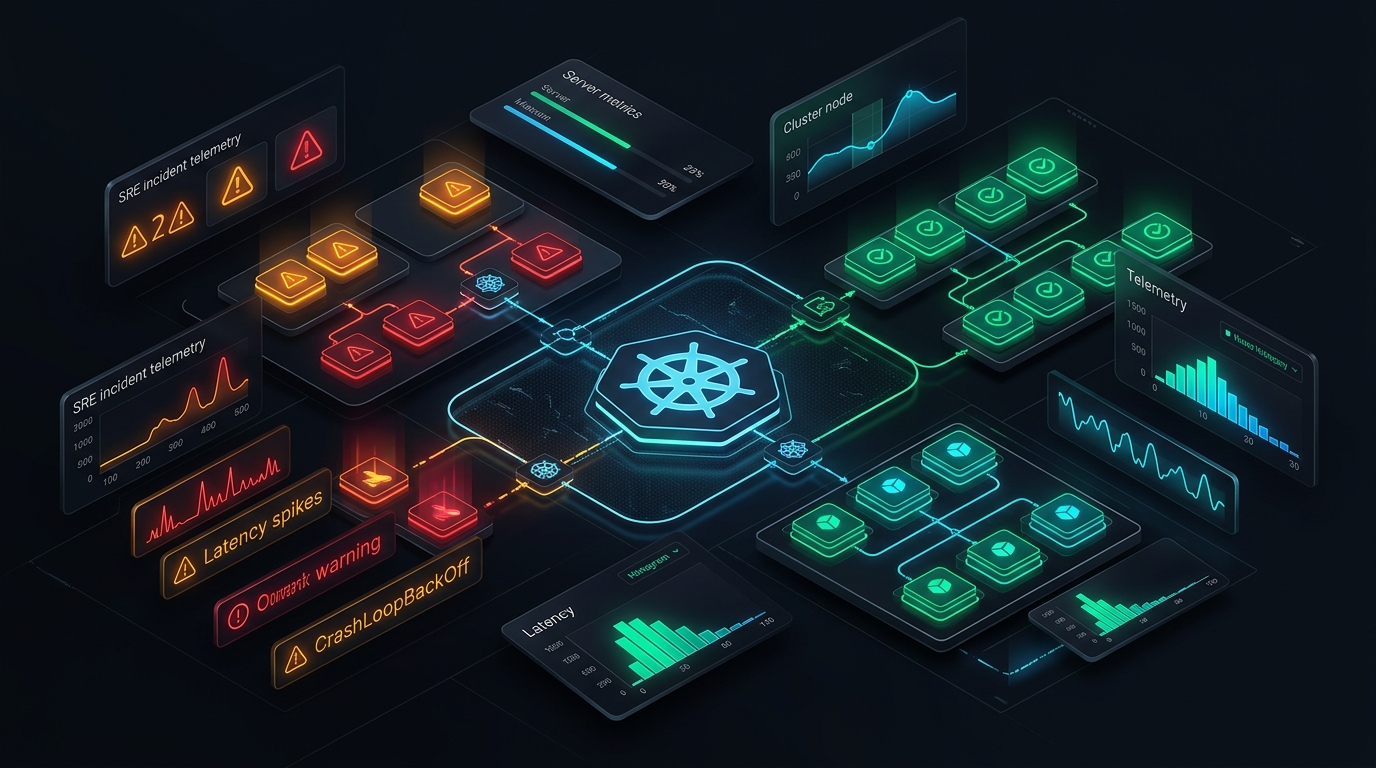
In enterprise infrastructure, Kubernetes issues rarely stem from simple syntax typos. The most catastrophic outages emerge from concurrency race conditions, kernel buffer limits, cloud API rate-limiting, and distributed consensus failures. Below are 12 real-world production incident postmortems from 10+ years of running enterprise cloud clusters, complete with root-cause forensics and permanent architectural solutions.
The 970+ Incident Handbook & K8s Runbooks are exclusive to subscribers — unlock for FREE
Get battle-tested production runbooks, AWS architecture blueprints, and zero-downtime CI/CD post-mortems sent directly to your inbox. 100% free, no spam.
12 Battle-Tested Kubernetes Production Postmortems
Each postmortem below outlines the operational impact, forensic diagnostic commands, root cause analysis, and the permanent architectural fix:
Postmortem 1: The Silent CoreDNS 5-Second Latency Spike
15% of checkout API requests delayed by exactly 5,000ms. End-user carts abandoned.
Prometheus showed occasional 5s p99 latency spikes on outbound HTTPS calls to payment gateways. No CPU or memory saturation on pods.
# Check conntrack insertion drops
conntrack -S | grep insert_failed

# Trace CoreDNS UDP requests from inside container
tcpdump -i eth0 udp port 53 -nnndots:5, an external query for api.stripe.com sequentially appended 5 cluster search domains before querying the root domain. When two queries hit the conntrack table on the same tuple simultaneously, the second packet was silently dropped by the kernel, triggering a 5.0-second UDP retransmission timeout.- Deploy NodeLocal DNSCache: Runs as a DaemonSet with a local loopback IP (
169.254.20.10), answering queries directly on the node via TCP and bypassing Netfilter conntrack. - Inject pod dnsConfig: Set
ndots: 2andsingle-request-reopenin workload specs. - Trailing Dots: Configure microservice environment variables with fully qualified domain names (
https://api.stripe.com.).
Postmortem 2: The Cascading Worker Node OOMKilled Storm
4 out of 10 worker nodes collapsed within 6 minutes; 80+ pods evicted in a cascading domino failure.
Kubelet stopped responding; nodes transitioned to NotReady. Remaining healthy nodes were suddenly overloaded with rescheduled pods, causing them to also crash.
BestEffort). When a data backlog arrived, these pods consumed all free host RAM:
# Check kernel dmesg for host OOM killer
dmesg -T | grep -i "Out of memory: Kill process"

# Inspect node allocatable vs total capacity
kubectl describe node ip-10-0-45-12.ec2.internal | grep -A 8 "Allocatable:"system-reserved and kube-reserved memory cushions, the Linux kernel OOM killer activated globally and terminated the containerd runtime and kubelet processes to protect the kernel.- Enforce Hard Kubelet Reservations: Set
--system-reserved=memory=1Giand--kube-reserved=memory=1Giin KubeletConfiguration. - Namespace LimitRanges: Enforce mandatory default memory requests and limits for all containers.
- PriorityClasses: Assign system components (CoreDNS, CNI) a high
PriorityClassto guarantee immunity from pod preemption.
Postmortem 3: AWS VPC CNI Subnet IP Exhaustion During Karpenter Autoscaling
New pods stuck in ContainerCreating; auto-scaled worker nodes unable to receive pod network interfaces.
Karpenter spun up 15 new c5.2xlarge instances during morning peak, but all scheduled pods failed with failed to assign an IP address: No available IPs in subnet.
WARM_IP_TARGET=30 per node:
# Inspect available IPs in subnet via AWS CLI
aws ec2 describe-subnets --subnet-ids subnet-03b9e4a821e29e92a \
--query "Subnets[*].[SubnetId,AvailableIpAddressCount]" --output table- Enable Prefix Delegation: Configure AWS VPC CNI to allocate
/28CIDR blocks (16 IPs per ENI slot) instead of individual secondary IPs (ENABLE_PREFIX_DELEGATION=true). - Custom Networking (Secondary CIDR): Attach a non-routable
100.64.0.0/16CGNAT CIDR block to the VPC dedicated solely to Kubernetes pod interfaces.
Postmortem 4: The Mutating Webhook Timeout Deadlock
Complete freeze of cluster deployments; zero pods could be created across any namespace for 45 minutes.
CI/CD pipelines failed on every kubectl apply. Developer helm releases errored with Internal error occurred: failed calling webhook.
failurePolicy: Fail. When the node hosting the webhook crashed, the API server attempted to connect to its ClusterIP service and timed out after 10 seconds:
# View registered webhook configurations
kubectl get mutatingwebhookconfigurations
kubectl get validatingwebhookconfigurations

# Check webhook failure policies
kubectl get mutatingwebhookconfigurations security-agent-webhook -o yaml | grep -A 2 failurePolicy- Emergency Unfreeze: Delete the blocking webhook configuration:
kubectl delete mutatingwebhookconfiguration security-agent-webhook. - Exclude System Namespaces: Add
namespaceSelectormatchingkubernetes.io/metadata.name: kube-systemwithNotInso control plane pods are never intercepted. - High Availability Webhooks: Run webhooks with at least 3 replicas, spread across zones with a PodDisruptionBudget.
Postmortem 5: Ingress-NGINX 502 Bad Gateway During Rolling Deployments
Random HTTP 502 Bad Gateway errors spike for 5-15 seconds whenever a deployment finishes a rollout.
Application health metrics report 100% success, but CloudWatch ALB and user-facing APM report intermittent 502s during releases.
SIGTERM signal from kubelet while simultaneously being removed from the Service Endpoints object.
However, updating Ingress-NGINX routing tables and draining backend keep-alive connection pools takes 2 to 4 seconds. The application container terminated immediately upon receiving SIGTERM, causing Ingress-NGINX to forward active user requests to a dead TCP socket.
# Inject preStop sleep hook into container spec
lifecycle:
  preStop:
    exec:
command: ["/bin/sh", "-c", "sleep 15"]Postmortem 6: StatefulSet EBS Volume Expansion Deadlock
PostgreSQL database pod failed to restart after PVC storage was expanded from 200Gi to 500Gi.
Pod stuck in ContainerCreating for 40 minutes with VolumeResizeFailed events.
optimizing state and cannot be modified again for 6 hours.
Additionally, the node hosting the pod was rebooted while the filesystem was actively resizing (
resize2fs), corrupting the ext4 journal block.- Rescue Mount: Detached volume from the worker node and attached to a rescue EC2 instance to execute non-destructive
e2fsck -f /dev/xvdf. - Volume Binding Mode: Enforce
volumeBindingMode: WaitForFirstConsumerin StorageClasses. - VolumeSnapshots: Mandate a verified
VolumeSnapshotexecution prior to any manual PVC storage modification.
Postmortem 7: Microservice Latency Spikes from Linux CFS CPU Throttling
Node.js and Go microservices suffered severe p99 latency degradation (from 25ms to 850ms) despite CPU utilization averaging only 35%.
APM showed random execution stalls. kubectl top pods showed low CPU usage.
cfs_period_us=100000).
Inspect Prometheus metric:
# Query throttled periods in Prometheus
sum(rate(container_cpu_cfs_throttled_periods_total[5m])) by (pod)
/ sum(rate(container_cpu_cfs_periods_total[5m])) by (pod) * 1001000m spawned 8 goroutines that collectively consumed 100ms of CPU time in the first 12ms of the period. The Linux kernel halted all execution threads for the remaining 88ms!- Remove Restrictive CPU Limits: In modern Kubernetes, remove CPU limits entirely on multi-threaded latency-sensitive microservices, keeping only accurate CPU requests for scheduling.
- Tune CFS Period: If CPU limits are legally mandated, increase
cpuCFSQuotaPeriodin KubeletConfiguration to smooth out bursty workloads.
Postmortem 8: etcd Fsync Latency Spikes on Shared Cloud Disks
API server requests took 15-30s; worker node heartbeats timed out, triggering spurious pod reschedulings.
Kubelet logs flooded with Error syncing pod, skipping: failed to "CreatePodSandbox" and etcd logged took too long to execute 1 leader proposal.
fsync(). The etcd nodes were deployed on AWS EBS GP2 volumes that exhausted their IOPS burst balance credits:
# Test etcd cluster disk performance
ETCDCTL_API=3 etcdctl check perf

# Inspect etcd fsync histogram in Prometheus
histogram_quantile(0.99, rate(etcd_disk_wal_fsync_duration_seconds_bucket[5m]))- Migrate to Dedicated Fast Storage: Run etcd on dedicated NVMe SSD instance stores or AWS EBS
io2volumes with guaranteed <10ms p99 fsync latency. - Automated Snapshots: Configure hourly
etcdctl snapshot saveroutines to S3 with automated checksum verifications.
Postmortem 9: The Silent Cluster-Wide TLS Certificate Expiration
The entire cluster became completely unresponsive to kubectl; kubelets could not authenticate to kube-apiserver.
kubectl get nodes returned Unable to connect to the server: x509: certificate has expired or is not yet valid.
kubeadm, the control plane PKI client certificates expire exactly 1 year after generation:
# Check certificate expiration dates
kubeadm certs check-expirationkube-apiserver.crt certificate expiration, resulting in an unannounced total control plane blackout at midnight.- Emergency Renewal:
kubeadm certs renew all systemctl restart kubelet - Automated Expiration Alerting: Deploy
cert-manageror Prometheus exporter monitoringx509_cert_not_afterwith alerts triggering at 30 days and 7 days before expiry.
Postmortem 10: NetworkPolicy Default-Deny Locking Out Inter-Service Traffic
Security team enabled zero-trust default-deny, breaking internal order processing for 3 hours.
Pods could ping each other's IP, but HTTP requests timed out with connection refused or SYN drop.
ingress: [] default-deny NetworkPolicy to meet SOC2 requirements, but forgot that Kubernetes NetworkPolicies are whitelist-only:
# Inspect NetworkPolicies affecting pod
kubectl get networkpolicy -n production -o wide
calicoctl get endpoints -o wide- Always Whitelist CoreDNS: Every egress network policy must explicitly permit traffic to port 53 in
kube-system. - Staged Policy Enforcement: Deploy Calico in audit/permissive mode before switching to enforce mode, verifying allowed flows in telemetry dashboards.
Postmortem 11: Docker Hub Anonymous Rate Limiting Halting Production Scaling
During an unexpected traffic surge, HPA scaled pods from 20 to 100, but all new pods failed with ImagePullBackOff.
kubectl describe pod showed Failed to pull image: toomanyrequests: You have reached your unauthenticated pull rate limit of 100 pulls per 6 hours.
python:3.11-slim was pulled directly from public DockerHub without an authenticated account. Because all worker nodes in the VPC egressed through a single AWS NAT Gateway elastic IP, DockerHub treated the entire cluster as a single anonymous client and rate-limited all image pulls across the company.- Mirror to Private ECR: Never pull public images directly in production manifests. Mirror all verified base images into private Amazon ECR repositories.
- ECR Pull-Through Cache: Configure ECR Pull-Through Cache rules to automatically cache upstream DockerHub images with zero code changes.
Postmortem 12: Ephemeral Storage Exhaustion via Zombie Process File Descriptors
Worker nodes entered DiskPressure status; healthy production pods were randomly evicted by kubelet.
df -h /var/lib/kubelet showed 100% disk usage, but running du -sh * revealed only 15GB of actual files.
emptyDir volume, deleted them via rm, but kept the file descriptors open in uncollected zombie processes.
In Linux, unlinked files remain on disk allocating physical blocks until all processes holding the open file descriptor terminate:
# Find open file descriptors holding deleted files
lsof +L1 /var/lib/kubelet/pods/imageGCHighThresholdPercent (85%) and began aggressively evicting pods.- Restart Leaking Process: Identify and kill the parent process holding the unlinked file descriptor to immediately release disk blocks.
- Enforce Ephemeral Storage Limits: Add
resources.limits.ephemeral-storage: 5Gito all container specifications to prevent single-pod disk exhaustion.
Resilience is not the absence of incidents—it is the ability to minimize blast radius and recover deterministically. Integrate these postmortem lessons into your infrastructure pipelines using GitOps, strict PodDisruptionBudgets, and proactive synthetic monitoring. To drill high-pressure troubleshooting drills, try the kubectl Crash Simulator Game or browse the Kubernetes SRE Interview Hub.