1. The SRE Philosophy: Outages Are Information, Not Disasters
When high-severity incidents strike, amateur teams immediately begin making speculative adjustments: tweaking database pool sizes in production consoles, restarting random pods, or restarting virtual machines in the blind hope that state resets will magically fix the problem. This approach creates compounding failure cascades and obliterates the ephemeral diagnostic telemetry required to pinpoint what broke.
In contrast, an SRE operates with one ironclad governing rule:
"Your first job during an outage is to mitigate customer impact, not to solve the mystery. Stop the bleeding, restore availability, and diagnose root causes only after the system is stabilized."
Site Reliability Engineering approaches system degradation through scientific falsification. We do not try to prove what is wrong; we rapidly disqualify potential failure domains until the blast radius contracts down to a single component. When you build this mental discipline, panic vanishes, replaced by a repeatable, calm operational loop.
Never attempt complex code rewrites or schema refactoring while an outage is active. If a commit broke production at 14:02, revert the release at 14:04. Speed of service restoration always beats the pride of finding an on-the-fly hotfix.
The 970+ Incident Handbook & K8s Runbooks are exclusive to subscribers — unlock for FREE
Get battle-tested production runbooks, AWS architecture blueprints, and zero-downtime CI/CD post-mortems sent directly to your inbox. 100% free, no spam.
2. Problem Symptoms & Quick Diagnosis: Spotting the Red Flags
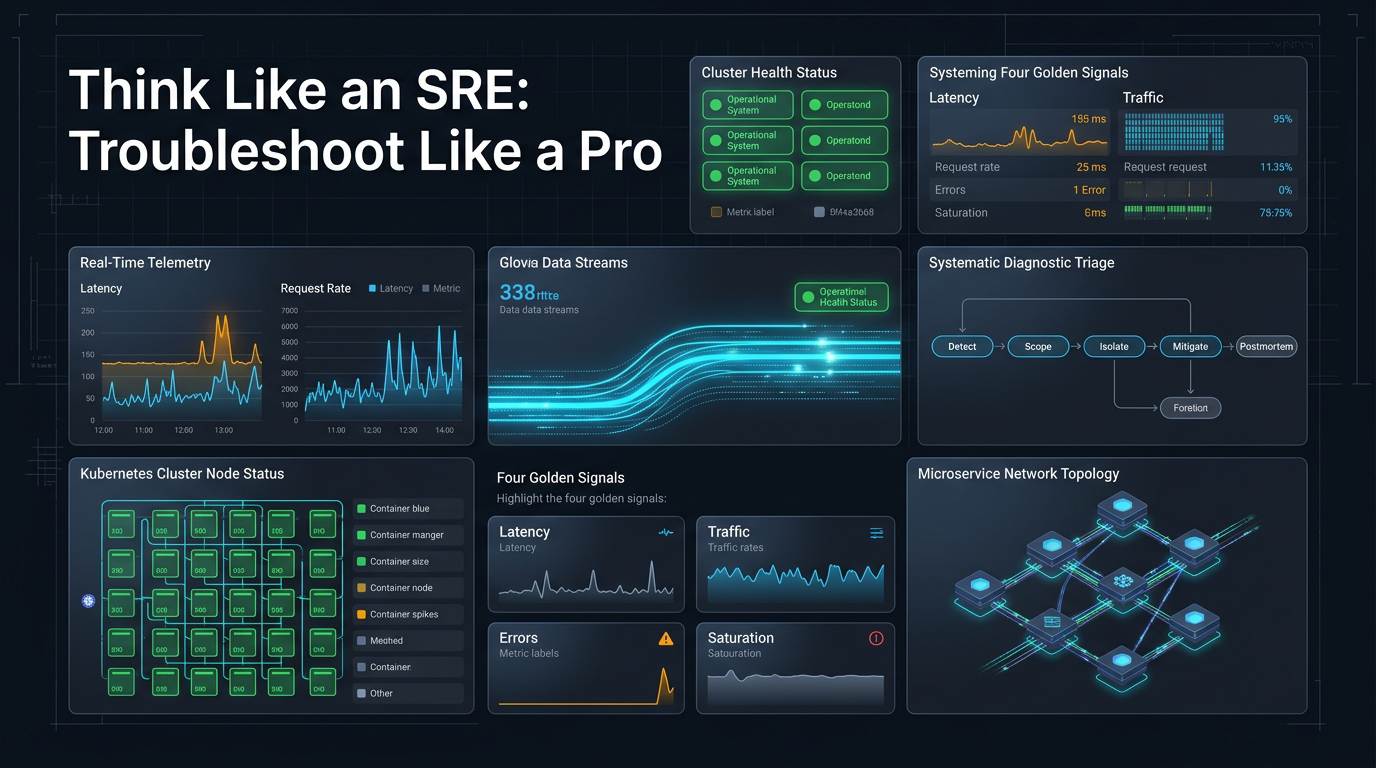
SaaS failures rarely announce themselves cleanly. Instead, they surface as subtle distortions in high-level telemetry. To bypass the deluge of noisy alerts, anchor your triage on the classic Four Golden Signals established by Google's SRE framework:
- Latency: The time it takes to service a request. Distinguish carefully between the latency of successful requests and failed requests. A spike in p99 or p95 response time while p50 remains flat indicates a single slow downstream dependency or database lock, not a widespread CPU starvation issue.
- Traffic: A measure of how much demand is placed on your system. In web applications, this is HTTP requests per second (RPS); in streaming pipelines, it is message ingestion rate. A sudden drop in traffic often means upstream ingress, Cloudflare, or Route53 DNS is failing before traffic ever reaches your ingress gateway.
- Errors: The rate of requests that fail, either explicitly (HTTP 5xx responses) or implicitly (returning HTTP 200 with an empty JSON body or error payload). A jump from an expected 0.05% baseline to 3.5% is an active critical incident requiring immediate triage.
- Saturation: How full your service is. Saturation measures constrained resources: CPU run queues, kernel connection tracking tables (
nf_conntrack), thread pool utilization, database memory buffers, and disk I/O wait times. A system operating at 98% saturation will experience non-linear latency spikes with even a tiny 2% increase in traffic.
In addition to the golden signals, watch for Silent Failures: background Celery/Sidekiq queues that stop draining, deadlocked Kafka consumer groups, or third-party webhooks silently returning timeouts. There is no user-facing HTTP 500 error page, but the core business domain is offline.
3. The 60-Second Initial Diagnostic Checklist
Before you run a single debugging command, open your incident journal and execute this 60-second five-point triage loop:
- Scope the Blast Radius: Is the failure localized to a single tenant, one Availability Zone, or is it hitting 100% of global traffic? Validate through synthetic monitors across independent external regions.
- Pinpoint Onset Time: Exactly what minute did the error rate spike? Look at your Grafana or Datadog error time series. A razor-sharp vertical step function points to a software deploy or config push; a gradual ramp points to a memory leak or connection leak.
- Examine the Change Log: What changed in the 60 minutes preceding the timestamp? Check CI/CD commit hashes, Helm releases, Terraform applies, feature flag flips, and secret rotations. Over 80% of production outages trace directly to a recent human change.
- Evaluate Dependency Health: Are your PostgreSQL Read Replicas responsive? Has Redis memory topped out? Is an external identity provider like Auth0 throwing 429 Too Many Requests?
- Communicate Early: Post a verified one-sentence status update to your status page and internal incident bridge: "We are investigating elevated error rates affecting payment processing starting at 14:15 UTC." Silence breeds anxiety; transparency buys time.
For hands-on scenarios and interactive problem sets covering these real-world failure patterns, check out the 970+ Production Interview Scenarios and test your speed on the Kubectl Crash Simulator Game.
4. Common Root Causes Explained in Plain Terms
While modern distributed systems appear endlessly intricate, real-world SaaS outages almost always decompose into three primary categories:
Infrastructure Failures: When the Foundation Shakes
Cloud providers like AWS, Azure, and Google Cloud operate on shared infrastructure. When an underlying physical hypervisor encounters hardware degradation, an Availability Zone suffers networking partition, or an Amazon EBS volume exhausts its GP3 burst IOPS credits, your applications inherit the blast radius. Common symptoms include:
- Sudden, simultaneous error spikes across unrelated microservices co-located in the same subnet or AZ.
- Elevated network round-trip time (RTT) and dropped TCP SYN packets between VPC subnets.
- Cloud provider status dashboards indicating "Operational issues with EC2/RDS in us-east-1".
Application Bugs: The Code That Slipped Past Staging
A developer merges a seemingly innocuous PR that introduces an unindexed database query (causing a full table scan on 20 million rows), a missing null check on an optional webhook field, or a shared goroutine/thread pool that deadlocks under concurrency. Key hallmarks:
- Errors correlate perfectly with a specific release tag or CI/CD deployment timestamp.
- The failure isolates down to specific API endpoints or worker job names.
- Logs show identical stack traces repeating thousands of times per minute.
Configuration Drift: The Silent Service Killer
Configuration drift occurs when an engineer makes an ad-hoc adjustment in an administrative portal, updates an environment variable without GitOps tracking, or when an expired TLS certificate suddenly cuts off ingress. Because no new container image was deployed, engineers mistakenly conclude the software "worked yesterday, so the code must be fine."
To learn how to permanently eradicate drift using declarative GitOps reconciliation loops, study our deep dive on GitOps with ArgoCD: Eliminating Configuration Drift.
| Symptom Pattern | Likely Root Cause | First Diagnostic Command |
|---|---|---|
| Sudden, global 502 Bad Gateway across all routes | Ingress proxy crash or upstream DNS failure | curl -svo /dev/null https://api.yoursaas.com/healthz |
| Error spike immediately following a release | Application regression or bad DB migration | kubectl rollout history deployment/api-service |
| Gradual latency climb over 48 hours without deploys | Memory leak, unindexed query, or connection pool leak | kubectl top pods -l app=api-service --containers |
| Only one Availability Zone or region failing | Cloud provider network partition or EBS latency | aws health describe-events --filter services=EC2 |
| Intermittent 504 Gateway Timeouts under peak load | Database connection pool starvation or thread deadlock | SELECT count(*), state FROM pg_stat_activity GROUP BY 2; |
5. Fast Triage Checks: Rule Out Simple Causes First
Before initiating heavy operational maneuvers, rapidly disqualify low-hanging variables:
1. Verify User-Side Anomalies
If only a handful of customers report failures, verify whether the issue is local to their corporate network. Test using an incognito session, disable local VPNs, and execute requests from multiple independent cloud test runners (such as a remote EC2 bastion host or public DNS resolvers like 1.1.1.1 and 8.8.8.8):
# Test DNS resolution against public resolvers
dig +trace api.yoursaas.com @1.1.1.1
dig +trace api.yoursaas.com @8.8.8.8

# Measure exact HTTP timing breakdown (DNS, TCP handshake, TLS, TTFB)
curl -w "\nDNS: %{time_namelookup}s\nConnect: %{time_connect}s\nTLS: %{time_appconnect}s\nTTFB: %{time_starttransfer}s\nTotal: %{time_total}s\n" \
  -o /dev/null -s https://api.yoursaas.com/healthz
2. Inspect Dependency Health Status
Modern SaaS architectures depend heavily on third-party SaaS vendors. If Stripe is degrading, your checkout flow will hang. If Auth0 has an outage, user logins will fail across all web clients. Before blaming your own internal code, check vendor status dashboards:
- AWS Health Dashboard & regional status feeds
- Cloudflare and Fastly edge network operational statuses
- Authentication providers (Okta, Auth0, Clerk)
- Transactional payment, email, and SMS gateways (Stripe, SendGrid, Twilio)
3. Audit the "Usual Suspects" Change Checklist
Ask your team the six foundational change questions:
- Did CI/CD trigger a release in the last 2 hours?
- Was a feature flag enabled or altered in LaunchDarkly / Unleash?
- Did an automated cron job trigger a heavy database migration or batch ETL?
- Did any TLS certificates expire or auto-renew?
- Did Route53, Cloudflare, or CDN cache rules get updated?
- Were any third-party API tokens, IAM roles, or KMS keys rotated?
6. Step-by-Step Solutions: From Easiest to Advanced
When addressing an active degradation, progress methodically through three ascending levels of remediation. Never skip Level 1 to jump directly into Level 3.
Level 1: Quick, Reversible Fixes (Restart, Retry, Rollback)
Level 1 actions are low-risk, highly reversible, and resolve over 70% of transient incidents:
- Roll Back the Release: If an incident correlates with a release, do not debug on a burning cluster. Revert immediately to the last known healthy container image:
# Immediately rollback a Kubernetes deployment to the prior revision kubectl rollout undo deployment/api-service -n production # Monitor the rollout status in real-time kubectl rollout status deployment/api-service -n production - Graceful Rolling Restart: If services suffer from thread deadlocks, JVM memory fragmentation, or hung socket connections, trigger an orderly rolling restart without dropping in-flight traffic:
# Trigger a zero-downtime rolling restart of all pods in a deployment kubectl rollout restart deployment/api-service -n production - Toggle Feature Flags Off: If the incident is tied to a new feature rollout, instantly flip the flag to
falsein your control plane. This immediately routes traffic back through the verified legacy code path without requiring a full redeployment.
For step-by-step guidance on pod crash loops and exit codes, read our comprehensive field guide on Kubernetes CrashLoopBackOff: Diagnostic Runbook.
Level 2: Intermediate Diagnostics (Logs, Metrics, Traces)
If Level 1 actions do not stabilize the service, transition to systematic observability inspection:
- Log Inspection: Filter logs by HTTP 5xx status codes, unhandled exceptions, and fatal panics across all instances:
# Tail logs from all pods matching the application label, filtering for fatal errors kubectl logs -f -l app=api-service -n production --tail=300 | grep -E "FATAL|ERROR|panic|Exception" # Check kernel messages for Out-Of-Memory kills dmesg -T | grep -i -E "oom[-_]killer|killed process" - Socket & Connection Inspection: Identify if connection pool starvation or socket leaks are blocking inbound requests:
# Display TCP sockets in TIME_WAIT and CLOSE_WAIT states ss -s ss -tulpn | grep :8080 - Distributed Tracing Waterfall: In OpenTelemetry, Datadog APM, or Jaeger, pull up traces from the 99th latency percentile. Look for horizontal timeline bars that consume 90%+ of total request time—typically an unindexed PostgreSQL query, a Redis lock contention, or an unresponsive third-party API.
Level 3: Advanced Remediation (Scaling, Failover, Circuit Breaking)
When high traffic volume or deep architectural bottlenecks threaten system stability, apply Level 3 tactical engineering controls:
- Aggressive Horizontal Scaling: Bump replica counts or cluster node provisioners (like Karpenter) to absorb sudden traffic surges:
# Scale up replicas immediately to absorb unexpected load kubectl scale deployment/api-service --replicas=50 -n production - Failover Traffic to Alternate Regions: If an entire AWS region is impaired, update Route53 latency/weighted routing or Cloudflare Load Balancing to drain traffic away from the degraded zone toward healthy backup infrastructure.
- Circuit Breaking & Load Shedding: Configure Envoy or your API gateway to drop non-essential traffic (such as background analytics, recommendation engines, or avatar uploads) with HTTP 429/503 responses while preserving critical paths like checkout, billing, and core login flows.
- Cache Warming & Thundering Herd Prevention: Following a cold restart of a database cluster, prevent sudden request floods from crushing the database by enabling stale-while-revalidate caching and staggered cache warmup scripts.
7. When to Seek Professional Help or Hardware Escalation
Knowing when to escalate is a hallmark of senior engineering maturity. Continuing to poke at an escalating disaster without the right specialists turns small incidents into irreversible catastrophes.
Critical Escalation Triggers
Escalate immediately to principal architects, database administrators, or security leadership if you observe:
- Data Corruption or Loss: If write queries are corrupting records or replica replication streams have diverged irrevocably, immediately put the database into read-only mode and page the Lead DBA. Do not run destructive
UPDATEscripts during an outage. - Security Compromise: Unusual egress traffic spikes, compromised API tokens, or unauthorized IAM role assumptions require invoking the Security Incident Response Team (SIRT). Standard debugging steps must yield to forensic preservation.
- Sustained Multi-Region Outages: If regional failovers fail to restore service, the problem is an architectural control plane deadlock or global DNS routing failure requiring executive engineering leadership.
How to Engage Cloud Vendor Support (AWS / GCP / Azure)
When opening a Critical (P1) ticket with cloud provider support, do not write vague summaries like "our servers are down." Cloud support engineers triage tickets based on technical completeness. Hand them a structured dossier:
[URGENT: P1 PRODUCTION IMPACT]
Service: Amazon RDS PostgreSQL (db-prod-cluster-primary)
Region: us-east-1 / AZ: us-east-1a
Incident Start: 2026-10-06 14:12:00 UTC
Observed Symptoms: Database instances unresponsive; failover replica hung in 'storage-full' state despite 40% allocated headroom.
CloudWatch Request ID: c72e9a11-884b-489e-99bf-01ab924ef812
Attempted Remediation: Triggered manual reboot; instance remains stuck in 'modifying' state for 25 minutes.
Business Impact: 100% of SaaS user transactions failing across all customer tiers.
Hardware Realities: When Cloud Virtualization Isn't Enough
In on-premises data centers, private clouds, or bare-metal colocation facilities (Equinix, Hetzner), hardware still fails physically:
- ECC memory errors triggering Linux kernel kernel panics.
- NVMe SSD controller crashes and RAID array degradation.
- Failed redundant power supply units (PSUs) or Top-of-Rack (ToR) switch port flapping.
In a managed cloud environment, "hardware repair" means opening a ticket requesting that AWS retire a degraded underlying hypervisor host and force an instance migration to healthy underlying compute.
8. Preventative Maintenance & Chaos Engineering
Troubleshooting like a pro during an outage is only half the battle. Elite SRE organizations invest heavily in preventative controls so the same incident never recurs twice.
1. Alert on Symptoms, Not Causes
Stop paging engineers because a worker node's CPU hit 85%. If the application is serving requests with zero errors and p95 latency under 120ms, an 85% CPU utilization metric is efficient resource utilization, not an emergency. Page on user-visible symptom degradation: elevated HTTP 5xx error rates, elevated TTFB, or exhausted SLO error budgets.
2. Multi-Window Error Budget Burn Rate Alerts
Modern SRE monitoring uses multi-window burn rate alerting on Service Level Objectives (SLOs). If you have a 99.9% availability target (allowing a 0.1% error budget over 30 days):
- Fast Burn: Burning 14.4x your budget over 1 hour (2% of monthly budget lost in 60 minutes) pages on-call immediately.
- Slow Burn: Burning 3x your budget over 6 hours creates a high-priority ticket for next-day remediation before the monthly budget is exhausted.
3. Chaos Engineering: Test Resilience Proactively
Do not wait for a random 3 AM Sunday hardware failure to learn whether your application handles database failovers cleanly. Inject controlled faults during business hours using tools like LitmusChaos, Chaos Mesh, or AWS Fault Injection Simulator:
- Terminate a random Kubernetes node in the middle of a business day. Does the ingress controller drain connections gracefully?
- Simulate 200ms artificial network latency on your Redis cluster. Does the application degrade gracefully into cache-miss fallbacks, or does it collapse in thread deadlocks?
- Sever connectivity to your third-party payment gateway. Does your frontend render a helpful retry message, or a broken white screen?
An outage without a postmortem is wasted tuition. Within 72 hours of resolving an incident, write a blameless postmortem. Focus on: What systemic defenses failed? Why did the monitoring fail to alert earlier? What safeguards can we engineer into CI/CD so this failure mode is physically impossible to deploy again?
9. Frequently Asked Questions
What does it mean to think like an SRE when troubleshooting a SaaS outage?
Thinking like an SRE means treating production outages as engineering problems rather than frantic fire drills. You stop guessing and start eliminating failure domains in a deterministic order: stabilize and mitigate customer impact first, isolate the blast radius second, and diagnose underlying root cause on a quieted system. Every incident produces telemetry that maps to a specific corrective action and a long-term architectural safeguard.
What are the first steps to take when my SaaS app goes down?
First, establish scope and blast radius: determine whether the failure affects all users, a single geographic region, or a specific API tenant. Next, verify provider status (AWS, Cloudflare, Auth0) and correlate the incident onset timestamp with deployments, feature flags, or database migrations shipped in the previous 60 minutes. If a recent release corresponds with the failure spike, initiate an immediate rollback before deep debugging.
How do I find the root cause of a SaaS incident quickly?
Work from the outside in using the Four Golden Signals (Latency, Traffic, Errors, Saturation). Check edge load balancers, then application ingress, container runtimes, database connection pools, and upstream third-party APIs. Compare active metrics against a 7-day baseline to spot anomalies, inspect recent configuration diffs, and follow distributed trace waterfall graphs to find the slowest failing component.
What metrics should I monitor to catch SaaS issues before users notice?
Prioritize symptom-based alerts over noisy infrastructure metrics. Monitor HTTP 5xx error rates, p95/p99 user-facing latencies, transaction completion success rates (e.g., checkout or authentication flows), and dependency queue depths. Implement multi-window burn rate alerts on Service Level Objectives (SLOs) rather than generic CPU usage thresholds.
How do I stay calm and organized during a high-pressure outage?
Adopt a formal Incident Commander (IC) structure. Designate one person to coordinate technical triage, one scribe to maintain an immutable chronological timeline, and one communications liaison to manage executive and customer updates. Timebox every working hypothesis to 5–10 minutes so engineers never rabbit-hole into dead ends while production remains down.
What should we do after the SaaS app is back up?
Conduct a blameless postmortem within 48 to 72 hours. Assemble a verified chronological timeline of events, calculate total user impact against error budgets, identify technical and organizational contributing factors, and create high-priority engineering action items to prevent recurrence. Share the findings transparently across the engineering organization.