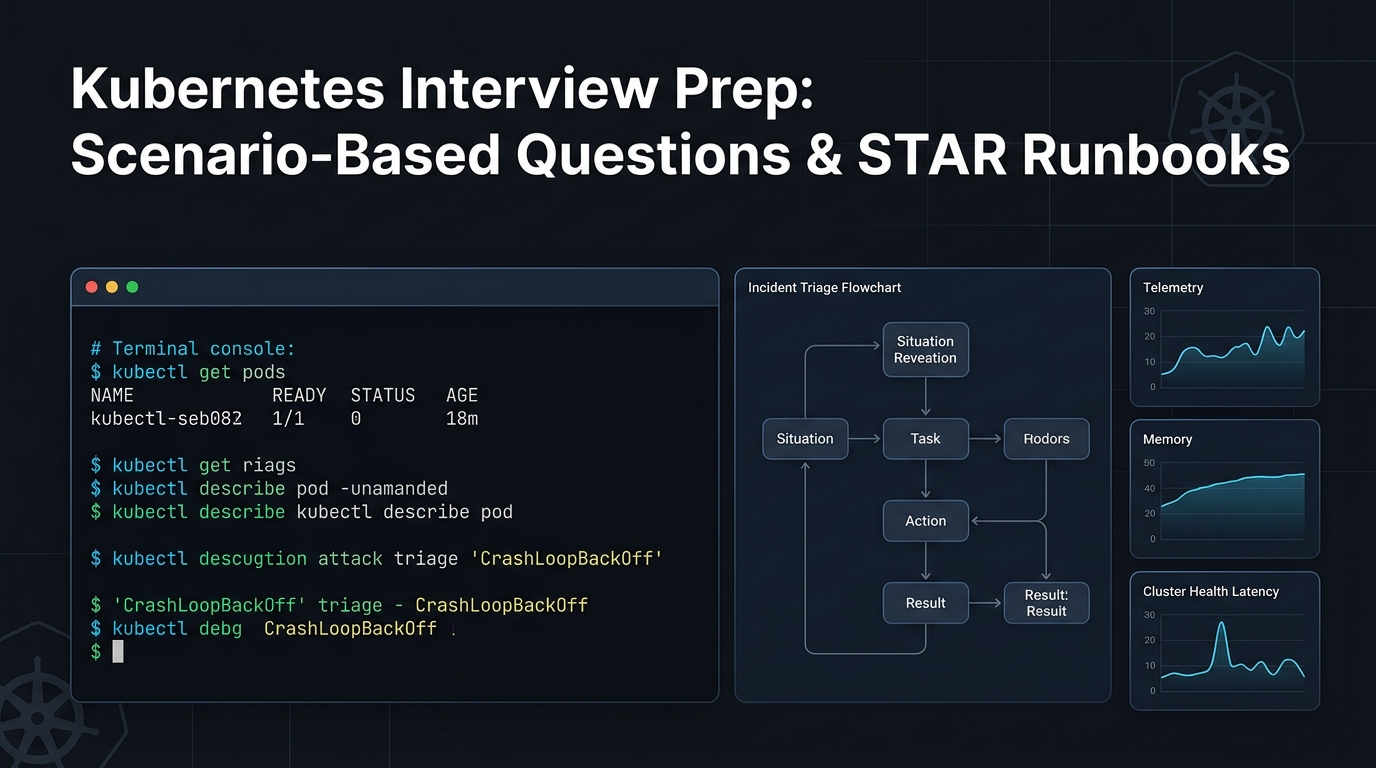
When an interviewer asks: "A production pod is in CrashLoopBackOff at 2 AM, what do you do?", they are not testing if you know the syntax of kubectl describe. They are evaluating your methodological discipline, non-destructive instincts, hypothesis prioritization, and blast-radius awareness. Candidates who jump straight into guessing random solutions fail; candidates who execute a deterministic 4-phase diagnostic framework receive instant hire recommendations.
1. The 4-Phase Diagnostic Heuristic Framework
Every scenario interview question must be addressed through a disciplined four-stage sequence:
Triage & Blast Radius
Determine the impact scope. Is this 1 pod, 1 namespace, or cluster-wide? Are end users receiving 5xx errors? Has traffic shifted to backup replicas?
Non-Destructive Telemetry
Inspect read-only state before modifying anything. Check describe events, previous container logs, exit codes, and Golden Signals (latency, errors, saturation).
Root Cause Isolation
Differentiate symptoms from causes. Is the pod restarting due to an OOMKill, or did a downstream DB connection failure cause memory leakage?
Remediation & Guardrails
Deliver both the immediate operational fix (rollback, scale, patch) AND the architectural prevention guardrail (PDB, limits, health probes, alerting).
The 970+ Incident Handbook & K8s Runbooks are exclusive to subscribers — unlock for FREE
Get battle-tested production runbooks, AWS architecture blueprints, and zero-downtime CI/CD post-mortems sent directly to your inbox. 100% free, no spam.
2. The Technical STAR Framework for Kubernetes Scenarios
When answering, structure your speech into the classic STAR model, but replace generic corporate speak with hard technical specifics:
- Situation: "At my previous SaaS platform, our checkout service experienced an incident where 20% of requests threw 502 Bad Gateway during our peak Black Friday rollout."
- Task: "My objective as the on-call Lead SRE was to stabilize traffic within 2 minutes, identify the failure mode, and ensure zero data loss."
- Action: "I first cordoned the node and executed
kubectl describe podto inspect termination reasons. I verified endpoints were missing due to an uncalibrated readiness probe, rolled back to the previous deployment replica set usingkubectl rollout undo, and confirmed traffic recovery via Prometheus p99 metrics." - Result: "We eliminated the 502 errors within 90 seconds, restored p99 latency to 42ms, and introduced a 15-second preStop sleep hook and PodDisruptionBudget that prevented recurrence across all 40 microservices."
3. 10 High-Frequency Scenario Walkthroughs & Battle Plans
Here are the 10 most common scenario questions asked by Tier-1 tech companies, complete with exact diagnostic commands and architectural remediation:
Scenario 1: Pod Stuck in Pending on a High-Priority Production Deployment
A Friday evening hotfix deployment fails to spin up new pods. The new ReplicaSet has 0/3 pods available, and existing pods are already handling 95% traffic.
Inspect events via kubectl describe pod <pod-name>. Is it resource starvation (Insufficient CPU/memory), unsatisfied nodeSelector/nodeAffinity, PVC binding failure, or taints without tolerations?
kubectl get pods -l app=payment-api -o wide
kubectl describe pod payment-api-79bf48-x9kz | grep -A 10 -i EventsNode group capacity exhausted; pod requests 4 CPU but worker nodes only have 2.8 allocatable CPU remaining.
Immediate: scale out node group via Karpenter / ASG, or adjust burstable requests down to match actual consumption. Permanent: implement PriorityClass preemption for business-critical pods and establish cluster-wide ResourceQuotas.
Scenario 2: Rapid CrashLoopBackOff with Exit Code 137 (OOMKilled)
Following a microservice release, pods repeatedly crash every 45 seconds, triggering PagerDuty high-severity alerts.
Check kubectl describe pod for Last State: Terminated, Reason: OOMKilled, Exit Code: 137. Use kubectl logs --previous to read the heap telemetry immediately before process termination.
kubectl describe pod checkout-svc-5c6d | grep -E 'State|Reason|Exit Code'
kubectl logs checkout-svc-5c6d --previous --tail=100JVM/Node.js memory limit set to 512Mi, but application initialization allocates 650Mi due to an unindexed database query result set in cache.
Immediate: bump container memory limit to 1Gi via rolling update patch. Permanent: configure memory profiler, tune JVM MaxRAMPercentage (-XX:MaxRAMPercentage=75.0), and add circuit breaker to the cache loader.
Scenario 3: Pod Running but Inaccessible (HTTP 503 Service Unavailable)
The deployment shows 3/3 pods in 'Running' state, but the Ingress and external ALB return HTTP 503 Service Unavailable.
Inspect Service Endpoints: kubectl get endpoints payment-svc. If
kubectl get endpoints payment-svc
kubectl describe pod payment-svc-x | grep -A 5 -i Readiness
kubectl exec -it debug-pod -- curl -v http://payment-svc:8080/healthzReadiness probe endpoint /healthz failed because application initialization took 40s, while initialDelaySeconds was set to 5s. Pod was Running, but kubelet stripped it from Endpoints.
Tune readinessProbe.initialDelaySeconds and add a dedicated startupProbe with failureThreshold 30 and periodSeconds 5.
Scenario 4: Intermittent 5-Second Latency Spikes Caused by CoreDNS Race Conditions
High-throughput checkout API reports p99 latency spikes of exactly 5.000 seconds on external Stripe and database requests.
Correlate packet traces and conntrack metrics. High UDP query frequency triggers Linux kernel conntrack race condition between IPv4 and IPv6 DNS queries with default ndots:5.
kubectl logs -n kube-system -l k8s-app=kube-dns --tail=100
conntrack -SSimultaneous UDP A and AAAA queries with ndots:5 causes kernel conntrack insertion conflict, dropping the second packet and triggering 5s UDP timeout retransmit.
Deploy NodeLocal DNSCache DaemonSet. Add options ndots:2 and single-request-reopen in pod dnsConfig. Append trailing dot to external URLs (api.stripe.com.).
Scenario 5: Ingress-NGINX Dropping 5% of Connections During Rolling Deploys
During normal CI/CD deployments, users report intermittent HTTP 502 Bad Gateway errors for ~10 seconds per release.
Inspect timing between Pod termination, endpoint deregistration, and Ingress routing table synchronization. The application container terminates faster than the Ingress controller can drain connections.
kubectl logs -n ingress-nginx -l app.kubernetes.io/name=ingress-nginx | grep -E '502|upstream'
kubectl get events --sort-by=.metadata.creationTimestampPod receives SIGTERM immediately and stops accepting connections, but kube-proxy and Ingress-NGINX take 2-4 seconds to propagate endpoint removal, routing requests to a dead socket.
Implement a preStop: exec: command: ['sleep', '15'] hook in the container spec and configure graceful connection shutdown in the application framework.
Scenario 6: EBS Multi-Attach Error Deadlock on StatefulSet Pod Rescheduling
A worker node hosting a MongoDB primary crashes. The StatefulSet pod is rescheduled on another node but hangs in ContainerCreating for 15+ minutes.
Inspect pod events: Warning FailedAttachVolume: Multi-Attach error for volume "vol-0a1b2c": Volume is already exclusively attached to one node and can't be attached to another.
kubectl describe pod mongo-0 | grep -A 5 FailedAttachVolume
kubectl get volumeattachment | grep vol-0a1b2cThe crashed EC2 node did not send a detach signal to AWS EBS before dying. AWS EC2 API locks the volume to the dead instance until forced or timeout.
Force delete or detach the volume attachment in AWS or delete the orphaned VolumeAttachment object. Preventative: configure AWS EBS CSI driver node timeout and use volumeBindingMode: WaitForFirstConsumer.
Scenario 7: AWS VPC CNI Secondary IP Exhaustion in Cluster Subnet
Karpenter launches new EC2 worker nodes during a traffic spike, but all new pods remain stuck in ContainerCreating with CNI network allocation errors.
Inspect kubelet and VPC CNI daemonset logs: Failed to create pod sandbox: plugin type="aws-cni" failed: add cmd: failed to assign an IP address: No available IPs in subnet.
kubectl logs -n kube-system -l k8s-app=aws-node --tail=100 | grep -i 'no available ip'
aws ec2 describe-subnets --subnet-ids subnet-0123456789abcdef0 --query 'Subnets[].AvailableIpAddressCount'Subnet /24 CIDR (251 usable IPs) exhausted because each EC2 node allocates warm IP target pools via WARM_IP_TARGET.
Immediate: enable AWS VPC CNI Prefix Delegation (allocates /28 CIDR blocks per ENI instead of individual IPs). Permanent: add secondary non-routable 100.64.0.0/16 CGNAT CIDR to VPC for pods.
Scenario 8: Mutating Webhook Timeout Freezing Entire Cluster Pod Creation
Developers report that no new pods can be launched anywhere across the cluster, including in development and staging namespaces.
Inspect kubectl get events -A: Internal error occurred: failed calling webhook "sidecar.istio.io": Post "https://istio-sidecar-injector.istio-system.svc:443": context deadline exceeded.
kubectl get mutatingwebhookconfigurations
kubectl get validatingwebhookconfigurations
kubectl get pods -n istio-systemWebhook configuration had failurePolicy: Fail and pointed to a service whose pods crashed during an OOM event. API server blocked all pod creations cluster-wide.
Emergency: delete or patch webhook to failurePolicy: Ignore. Permanent: configure 3 webhook replicas with PodDisruptionBudget, topologySpreadConstraints, and exclude system namespaces via namespaceSelector.
Scenario 9: etcd Fsync Latency Spikes and Control Plane Stalls
kubectl commands take 15 seconds to return or time out with HTTP 504 Gateway Timeout. Grafana shows etcd disk fsync latency exceeding 100ms.
Inspect Prometheus metric etcd_disk_wal_fsync_duration_seconds_bucket and etcd_server_leader_changes_seen_total.
ETCDCTL_API=3 etcdctl --write-out=table check perf
ETCDCTL_API=3 etcdctl endpoint status -w tableetcd data directory mounted on shared, burstable GP2/GP3 EBS volume that exhausted IOPS burst balance credits, causing write queue backups.
Migrate etcd to dedicated NVMe SSD instance-store volumes or provisioned IOPS io2 volumes with guaranteed 3,000 IOPS and <10ms fsync latency.
Scenario 10: HPA Thrashing and Pod Flapping Under Spiky Microservice Traffic
A notification microservice scales from 5 to 50 pods, then drops to 5, then scales back to 50 every 3 minutes, causing severe database connection pool churn.
Inspect HPA configuration: kubectl describe hpa notification-hpa. Notice lack of scale-down stabilization window.
kubectl describe hpa notification-hpa
kubectl get hpa notification-hpa -wHPA evaluated instantaneous CPU spikes without scale-down dampening, terminating pods immediately before the next batch job arrived.
Add behavior.scaleDown.stabilizationWindowSeconds: 300 and configure rate-limiting step policies (max 10% pod reduction per minute).
4. The 60-Second Command Toolkit for Live Coding / Screen Shares
Keep these memorized commands at your fingertips when an interviewer hands you a live broken Kubernetes cluster:
# 1. Identify all unhealthy resources in cluster at a glance
kubectl get pods -A | grep -v -E "Running|Completed"

# 2. Sort pods by restart count to spot flapping containers
kubectl get pods -A --sort-by='.status.containerStatuses[0].restartCount'

# 3. View events sorted chronologically
kubectl get events -A --sort-by='.metadata.creationTimestamp' | tail -n 25

# 4. Check node resource capacity and pressure
kubectl top nodes
kubectl describe nodes | grep -A 5 "Conditions:"

# 5. Extract previous crash logs without scrolling
kubectl logs <pod> -c <container> --previous --tail=50Remember: Interviewers love candidates who speak like experienced production owners. Always mention observability, rollback safety, automated alerts, and postmortem blameless culture. For 196+ additional interactive scenario questions, explore the complete catalog on interview.naveedkumbhar.com.