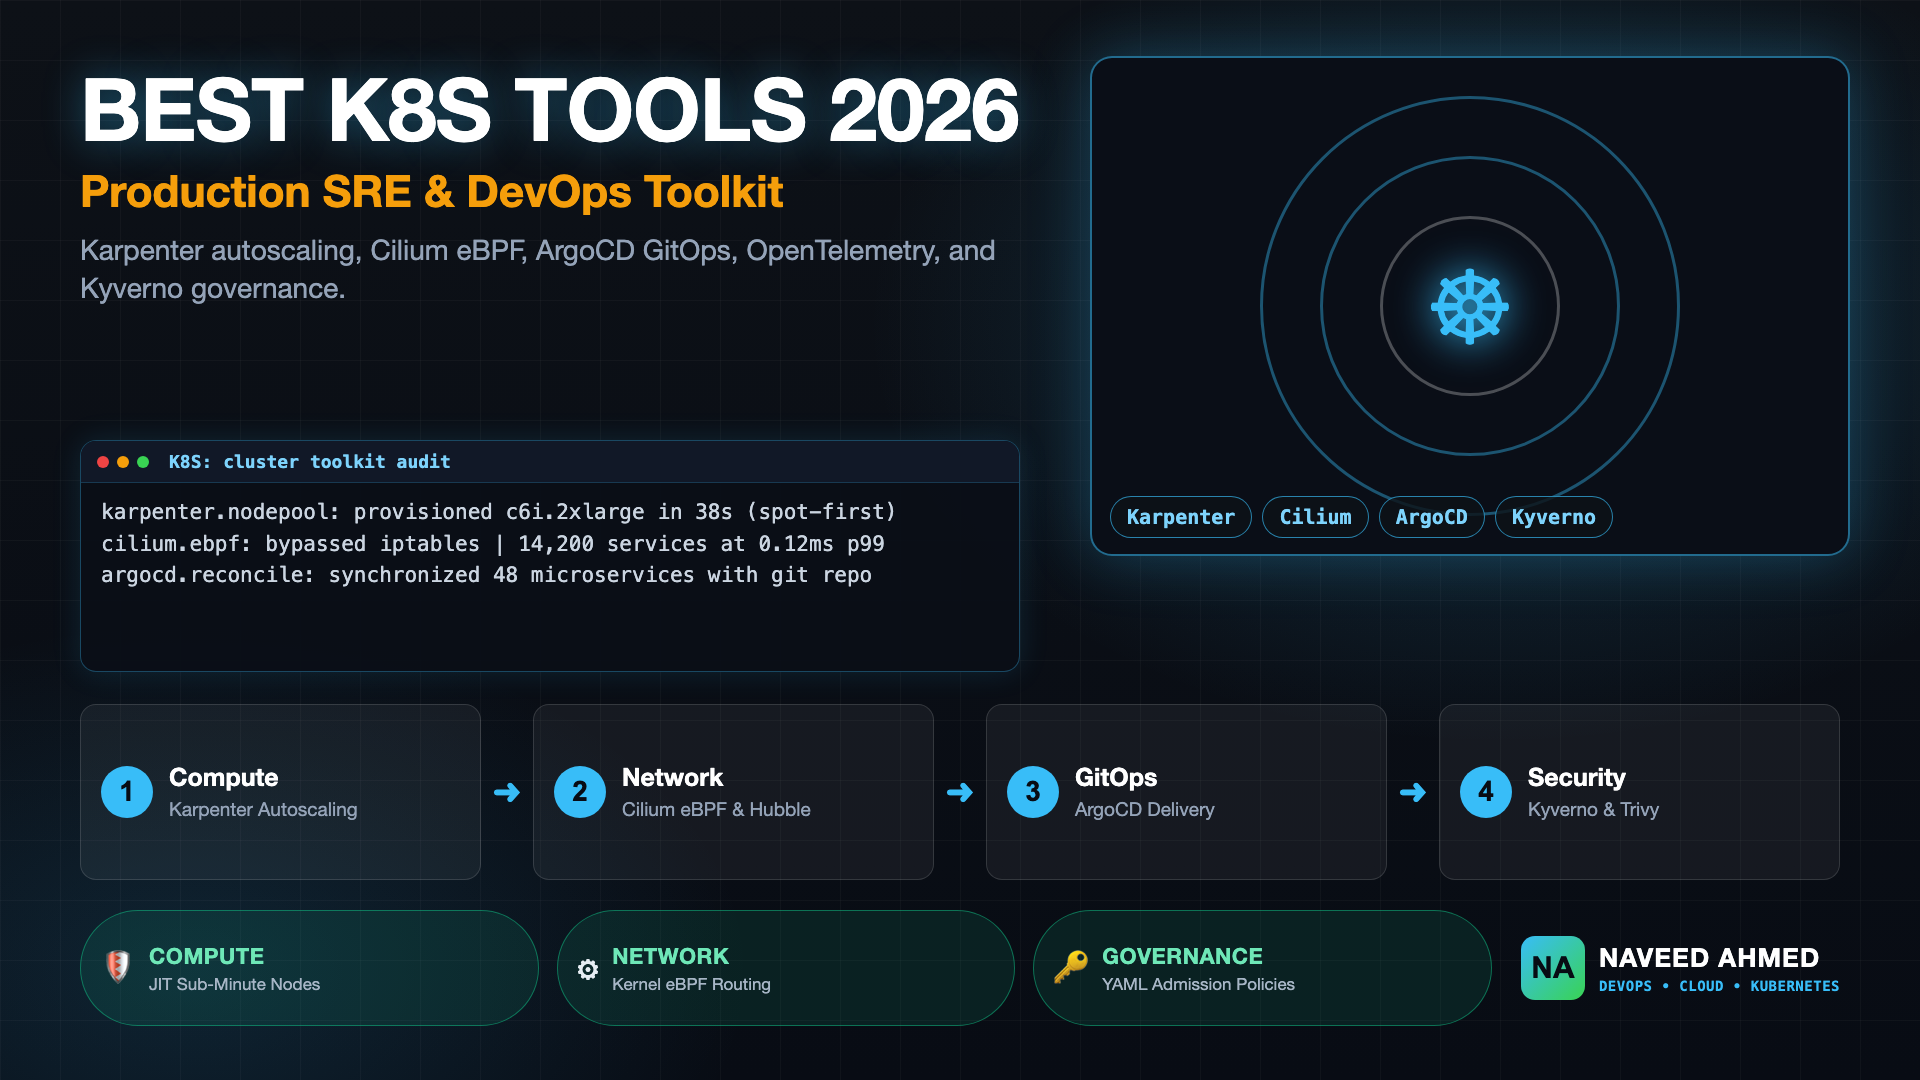
Selecting the best kubernetes tools 2026 requires navigating a vast CNCF landscape of thousands of projects. For platform engineers and site reliability engineers, separating ephemeral experiments from battle-tested utilities is essential. In this curated production guide, we analyze the definitive open-source toolkit powering high-scale, resilient production clusters. Rather than presenting an uncurated list of dozens of obscure utilities, we organize the production stack across six foundational engineering pillars: JIT compute autoscaling, eBPF-powered networking, declarative GitOps continuous delivery, unified observability, admission governance, and high-velocity developer CLI tools.
Best Kubernetes Tools 2026: The 6 Pillars of Modern Infrastructure
The modern Kubernetes stack has evolved beyond legacy controllers and static configuration scripts. In 2026, enterprise platform teams organize their cluster infrastructure around six core functional pillars, replacing brittle operational paradigms with automated, self-healing, and kernel-accelerated open-source standards.
Selecting the best kubernetes tools 2026 requires moving away from fragmented, ad-hoc utilities toward cohesive, standardized platforms. The matrix below contrasts the 2026 production standard with the legacy systems they have superseded, highlighting the core technical rationale for modernization.
| Architectural Pillar | 2026 Standard Tool | Replaces Legacy Tool | Primary Production Advantage |
|---|---|---|---|
| 1. Compute Autoscaling | Karpenter | Kubernetes Cluster Autoscaler | Direct cloud API provisioning; sub-45s node launches; automatic bin-packing and Spot consolidation. |
| 2. Networking & Mesh | Cilium (eBPF) | kube-proxy (iptables) | O(1) in-kernel packet routing; Hubble network observability; L7 identity-aware security policies. |
| 3. Delivery & GitOps | ArgoCD | Jenkins push deployments | Declarative pull-based synchronization; zero cluster credential leakage; automated drift remediation. |
| 4. Observability | OpenTelemetry + Prometheus | Proprietary vendor agents | Unified metrics, traces, and structured logs; vendor-neutral collector pipelines; eBPF profiling. |
| 5. Governance & Security | Kyverno + Trivy | PodSecurityPolicies (PSP) | Native YAML validation/mutation policies without Rego; continuous in-cluster CVE scanning. |
| 6. SRE Diagnostics & CLI | k9s + kubectx + Stern | Raw kubectl commands | Real-time terminal TUI; rapid multi-cluster context switching; multi-pod regex log streaming. |
Mastering these foundational tools transforms Kubernetes from a source of operational toil into an automated self-healing platform. For practical command mastery, leverage our Kubectl Command Cheat Sheet and learn to generate hardened production specs with the Free Kubernetes YAML Generator.
The 970+ Incident Handbook & K8s Runbooks are exclusive to subscribers — unlock for FREE
Get battle-tested production runbooks, AWS architecture blueprints, and zero-downtime CI/CD post-mortems sent directly to your inbox. 100% free, no spam.
Pillar 1: Compute Autoscaling with Karpenter
Karpenter has fundamentally disrupted Kubernetes node provisioning by bypassing legacy cloud Auto Scaling Groups (ASGs). By evaluating unscheduled pod constraints directly and calling cloud compute APIs on-demand, Karpenter launches right-sized worker nodes in under 45 seconds while driving down infrastructure costs.
In traditional cluster setups, when pods entered a Pending state due to CPU or memory exhaustion, the legacy Cluster Autoscaler was forced to wait for cloud ASGs to scale up predefined instance groups. This process typically took 4 to 8 minutes, frequently resulted in sub-optimal instance sizing, and complicated mixed Spot/On-Demand fleet architectures. If your cluster experiences scheduling bottlenecks, read our complete runbook on triage for pods stuck in Pending state.
Karpenter evaluates the specific resource requests, node selectors, taints, and architecture labels of pending pods. It dynamically selects the cheapest available EC2 instance type (graviton, AMD, or Intel) across dozens of instance families, packs workloads efficiently, and automatically consolidates or terminates underutilized nodes when workloads scale down.
Below is a production-hardened Karpenter NodePool configuration demonstrating automated consolidation, Spot-first purchasing, and disruption budgets:
# Karpenter NodePool v1 Configuration
apiVersion: karpenter.sh/v1
kind: NodePool
metadata:
  name: general-compute-spot
spec:
  template:
    spec:
      nodeClassRef:
        group: karpenter.k8s.aws
        kind: EC2NodeClass
        name: default-al2023
      requirements:
        - key: "karpenter.k8s.aws/instance-category"
          operator: In
          values: ["c", "m", "r"]
        - key: "karpenter.k8s.aws/instance-generation"
          operator: Gt
          values: ["5"]
        - key: "karpenter.sh/capacity-type"
          operator: In
          values: ["spot", "on-demand"]
        - key: "kubernetes.io/arch"
          operator: In
          values: ["amd64", "arm64"]
  disruption:
    consolidationPolicy: WhenEmptyOrUnderutilized
    consolidateAfter: 1m
    budgets:
      - nodes: 10%
  limits:
    cpu: "500"
    memory: 2000Gi
Pillar 2: High-Performance Networking & eBPF Mesh with Cilium
Cilium leverages Extended Berkeley Packet Filter (eBPF) technology inside the Linux kernel to replace the legacy kube-proxy networking layer. By bypassing sequential iptables packet filtering, Cilium delivers line-rate throughput, transparent WireGuard encryption, and L7 API security observability.
As Kubernetes clusters expand past several hundred Services, Linux iptables suffers an O(N) performance cliff where every packet evaluation requires traversing thousands of rules sequentially. Cilium replaces this bottleneck with O(1) in-kernel BPF maps, resulting in sub-millisecond p99 latencies even in clusters running tens of thousands of microservices.
Beyond raw performance, Cilium provides Hubble, a deep network observability platform that visualizes service-to-service communication, DNS latency, and HTTP status codes without requiring invasive sidecars. The following CiliumNetworkPolicy demonstrates identity-aware, L7 HTTP filtering:
# Cilium Identity & L7 Network Security Policy
apiVersion: "cilium.io/v2"
kind: CiliumNetworkPolicy
metadata:
  name: secure-checkout-api
  namespace: e-commerce
spec:
  endpointSelector:
    matchLabels:
      app: checkout-service
  ingress:
    - fromEndpoints:
        - matchLabels:
            app: frontend-gateway
      toPorts:
        - ports:
            - port: "8080"
              protocol: TCP
          rules:
            http:
              - method: "POST"
                path: "/api/v1/orders"
              - method: "GET"
                path: "/healthz"
Pillar 3: Declarative GitOps Delivery with ArgoCD
ArgoCD has emerged as the definitive GitOps continuous delivery tool for Kubernetes. By continuously comparing desired state committed in Git with actual cluster runtime state, ArgoCD automates progressive deployments, eliminates manual configuration drift, and ensures high release velocity.
In mature enterprise architectures, continuous integration ends at the container registry. ArgoCD handles continuous deployment by pulling changes from a GitOps configuration repository. This model eliminates the severe security vulnerability of storing cloud access keys inside CI/CD runners, as explored in our guide on GitHub Actions vs Jenkins.
When combined with Argo Rollouts, engineering teams execute zero-downtime blue-green and progressive canary deployments with automated rollback on metric thresholds. For deeper architectural patterns, consult our deep dive on GitOps with ArgoCD eliminating configuration drift.
Pillar 4: Unified Observability with OpenTelemetry and Prometheus
Observability in distributed Kubernetes environments requires capturing metrics, structured logs, and distributed traces without proprietary vendor lock-in. OpenTelemetry standardizes telemetry collection, while Prometheus and Thanos govern high-cardinality metric storage and alerting.
In modern clusters, deploying separate agents for every vendor (Datadog, Dynatrace, New Relic) consumes excessive node memory and creates fragile daemon sets. The 2026 standard deploys the OpenTelemetry Collector as a unified gateway:
- Application Instrumentation: Auto-instrumenting traces via eBPF or OpenTelemetry SDKs with W3C TraceContext propagation.
- Metric Aggregation: Scraping Prometheus metrics natively and routing them via OTLP (OpenTelemetry Protocol) to Amazon Managed Prometheus, Grafana Mimir, or Google Cloud Monitoring.
- Log Transformation: Enriching container stdout logs with Kubernetes pod metadata, namespace labels, and trace IDs before forwarding to Loki or OpenSearch.
Explore our comprehensive guide on 10 Kubernetes production problems SREs check first to understand how metrics and probe health prevent cascading failures.
Pillar 5: Zero-Trust Governance & Security with Kyverno and Trivy
With the deprecation of PodSecurityPolicies (PSP), Kubernetes admission control has shifted to declarative policy engines. Kyverno validates and mutates incoming resource manifests using native Kubernetes YAML, while Trivy audits running container images for CVEs and configuration compliance.
Unlike Open Policy Agent (OPA) Gatekeeper, which requires engineers to learn the complex Rego query language, Kyverno defines policies entirely in standard Kubernetes declarative syntax. It intercepts Kubernetes API admission requests, blocks insecure configurations, and generates cluster-wide compliance reports.
# Kyverno ClusterPolicy: Enforce Read-Only Root Filesystem and Non-Root User
apiVersion: kyverno.io/v1
kind: ClusterPolicy
metadata:
  name: enforce-container-security-baseline
spec:
  validationFailureAction: Enforce
  background: true
  rules:
    - name: require-non-root-user
      match:
        any:
          - resources:
              kinds:
                - Pod
      validate:
        message: "Running containers as root is strictly prohibited in production."
        pattern:
          spec:
            securityContext:
              runAsNonRoot: true
            containers:
              - securityContext:
                  readOnlyRootFilesystem: true
                  allowPrivilegeEscalation: false
Paired with the Trivy Operator, which continuously scans running workloads against updated vulnerability databases, platform teams maintain audit-ready security posture across SOC 2, HIPAA, and PCI-DSS compliance frameworks.
Pillar 6: High-Velocity SRE Terminal Diagnostics (k9s, Helm, Kubectx)
While web dashboards provide high-level metrics, on-call SREs resolve live incidents in the terminal. Utilities like k9s, kubectx, and Stern reduce cognitive friction and dramatically cut Mean Time to Resolution (MTTR) during active production incidents.
During a high-severity outage, typing verbose kubectl get pods -n production -o wide and parsing JSONPath outputs manually introduces human error. The 2026 SRE terminal toolkit includes:
- k9s: A curses-based terminal UI that provides real-time workload monitoring, instant pod restart inspection, resource utilization graphs, and interactive container shell execution with single keystrokes.
- kubectx and kubens: Lightning-fast context and namespace switching that prevents accidental commands against production clusters.
- Stern: Multi-pod log tailing that streams logs across all replicas of a deployment simultaneously using regular expressions, color-coding each pod for rapid error correlation.
Find additional speed drills and operational workflows on the Kubernetes Production Troubleshooting Guide.
Selection Strategy: How to Assemble Your Kubernetes DevOps Toolkit
Building a successful platform engineering stack requires selecting tools that complement each other rather than introducing overlapping operational complexity. Teams should adopt a progressive three-tier adoption model to avoid cognitive overload.
When selecting the best kubernetes tools 2026, avoid installing every CNCF project simultaneously. Instead, follow a phased architectural maturity model:
- Tier 1 — Core Foundation (Day 1): Establish compute autoscaling with Karpenter, standard CNI routing with Cilium, and developer CLI tooling (k9s, kubectx).
- Tier 2 — Delivery & Telemetry (Day 30): Implement declarative pull-based GitOps with ArgoCD, coupled with the OpenTelemetry Collector and Prometheus stack for unified observability.
- Tier 3 — Governance & Security (Day 90): Layer in Kyverno admission policies, automated image signing with Cosign, and continuous vulnerability scanning via Trivy.
By standardizing on this curated 2026 toolkit, engineering organizations eliminate controller maintenance, reduce AWS compute waste through Karpenter JIT provisioning, secure workloads with eBPF and Kyverno, and empower SREs to deploy and operate cloud-native infrastructure with confidence.
Frequently Asked Questions
What are the most essential Kubernetes tools for production in 2026?
The modern production baseline comprises Karpenter for just-in-time compute autoscaling, Cilium for high-performance eBPF networking and network policies, ArgoCD for declarative GitOps continuous delivery, Prometheus and OpenTelemetry for observability, Kyverno for admission governance, and k9s for daily terminal troubleshooting.
Why is Karpenter preferred over the Kubernetes Cluster Autoscaler?
Karpenter provisions compute nodes directly via cloud APIs in under 45 seconds without requiring pre-configured Auto Scaling Groups (ASGs). It optimizes cluster costs through automated bin-packing, continuous node consolidation, and intelligent mixed-instance Spot selection.
Why are engineering teams migrating from kube-proxy to Cilium eBPF?
Traditional kube-proxy relies on sequential Linux iptables rules, which suffer severe performance degradation (O(N) latency penalties) in clusters with thousands of Services and Pods. Cilium uses eBPF in-kernel BPF maps (O(1) lookups), delivering lower latency, native L7 observability via Hubble, and transparent WireGuard encryption.
What open-source tools replace deprecated Kubernetes PodSecurityPolicies?
Kyverno and Open Policy Agent (OPA) Gatekeeper have replaced deprecated PodSecurityPolicies. Kyverno is widely favored by DevOps teams because it defines security policies, mutations, and validations using native Kubernetes YAML manifests without requiring a specialized query language like Rego.
Which CLI utilities provide the highest daily productivity for Kubernetes SREs?
k9s provides a real-time terminal UI for managing workloads, inspecting logs, and executing interactive shells. Paired with kubectx/kubens for rapid context switching and Stern for multi-pod regex log streaming, SREs resolve cluster incidents significantly faster than using standard kubectl alone.